


Is performance under pressure an illusion or reality?
Is Chisnall a choker? Does Wade’s precision go up a notch in the moments that matter? Or are these beliefs nothing more than myths originating from some of the most memorable moments those players have been involved in? As sports fans we love to stick labels on professionals and search for explanations behind what we see.
An accepted truth is that people’s brain activity is different in situations with enhanced levels of stress, and this results in different behavioural responses. Whether or not this means better or worse outcomes when throwing darts at a target, is more of an unknown. The metrics we used for this study are those we track to indicate changes in accuracy in circumstances that we would typically consider as having higher levels of pressure. The period covered is from the beginning of 2017, to ensure the data sample is large enough to be meaningful.

We ran a social media survey asking for views about dart players who are good and bad under pressure, with the intention of investigating those whilst exploring more generally whether there is numerical evidence to support theories about performance under pressure.
This article and the research underpinning it are in no way a complete reflection of data points that could be used for this topic, and there is no definitive answer. It is a complex subject that could go into lots more detail, not to mention that wherever we see performance fluctuations, we can never be sure what caused them. All we can do is identify patterns in information, which become of more interest the more profound they are, and the larger the data sample is.
The conditions for a player to be included in the entire sample that was analysed were that they had to have a PDC tour card, and they must have thrown at least 200 darts in every data category that we use as an ‘under pressure’ scenario.
These categories are:
- Averages – on TV and in finals (compared to normal)
- Doubles – on TV, in situations with opponents also waiting on a double, and match darts (compared to normal)
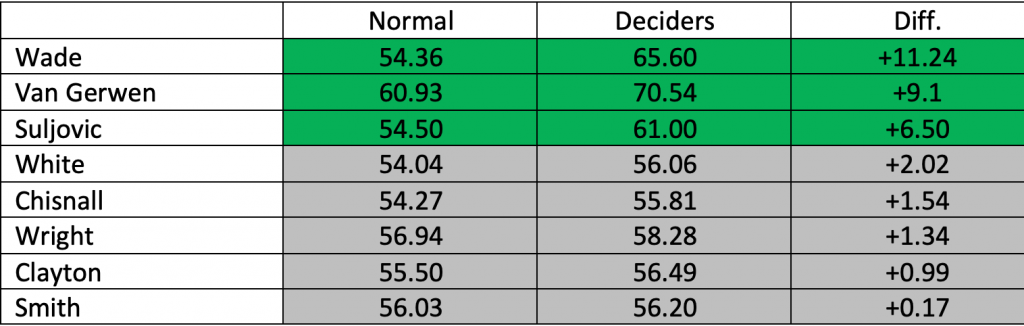
- Deciding legs – win/loss ratios and averages (compared to normal)
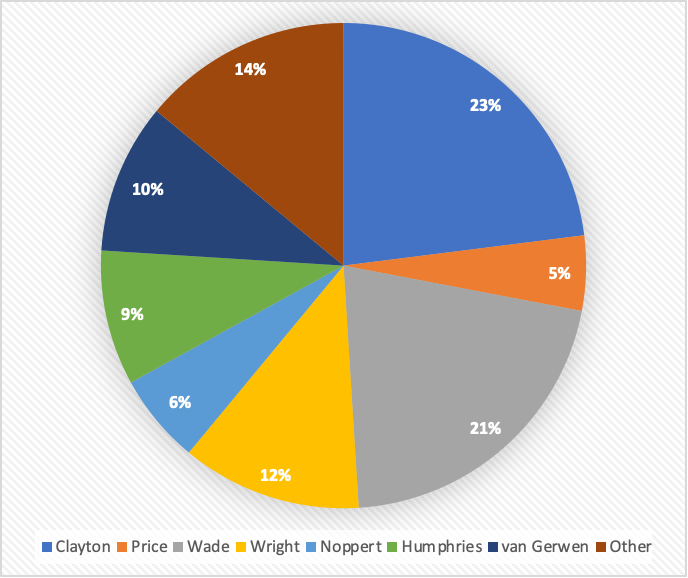
Darts Orakel Survey Responses: Best Players under Pressure
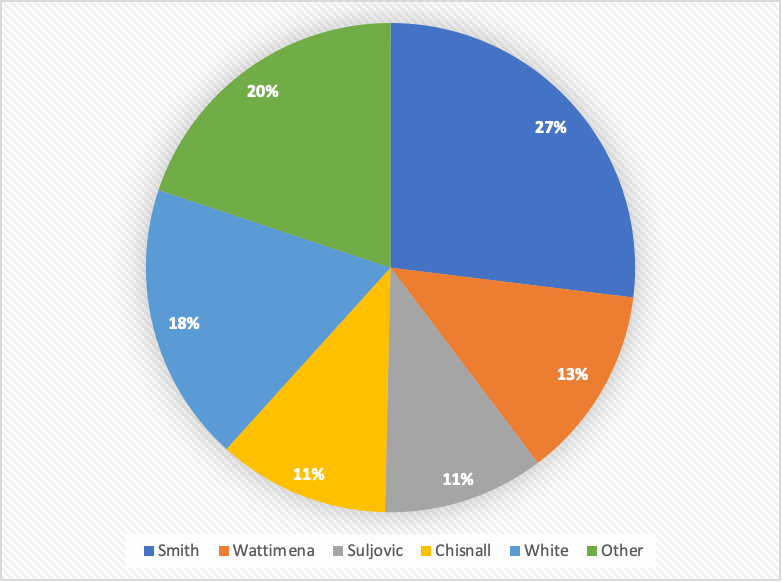
Darts Orakel Survey Responses: Worst Players under Pressure
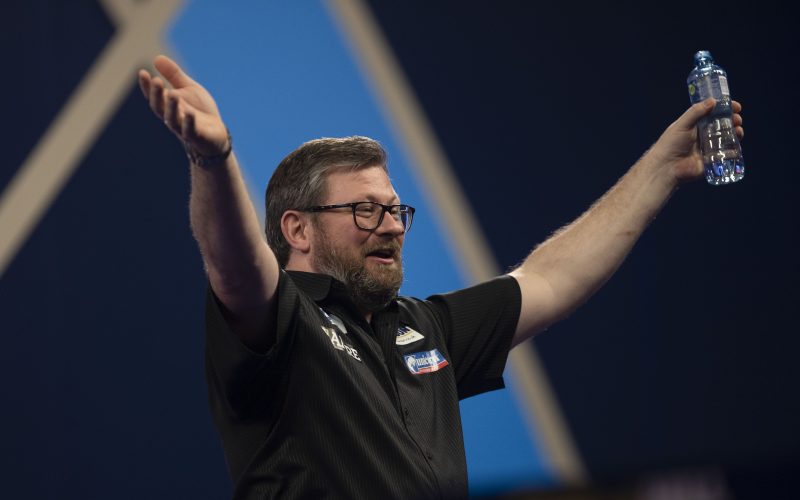
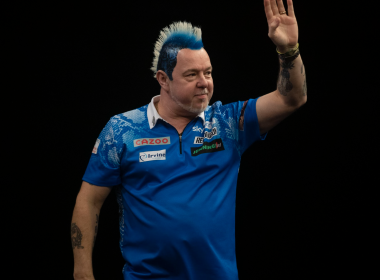
The four players most widely considered to be strong under pressure were: (1) Jonny Clayton; (2) James Wade; (3) Peter Wright; (4) Michael van Gerwen.
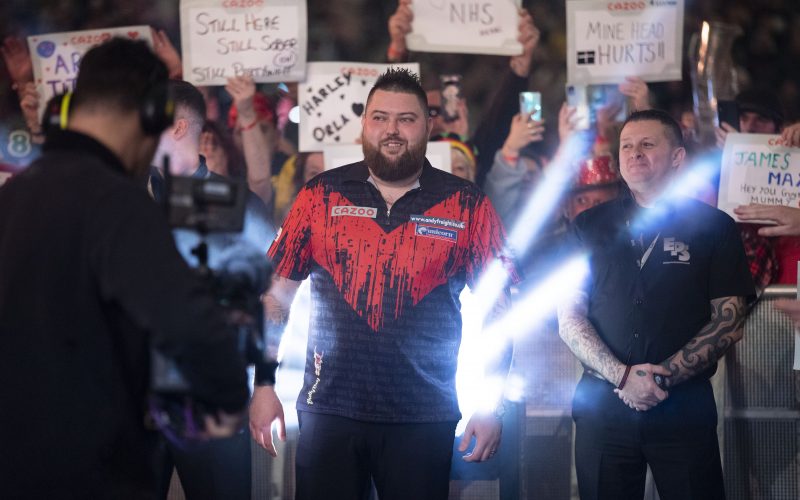
The four players most widely considered to be weak under pressure were: (1) Michael Smith; (2) Dave Chisnall; (3) Ian White; (4) Mensur Suljovic*
*Jermaine Wattimena was a more popular choice than Suljovic but did not meet the criteria for having the minimum number of darts thrown in each category, so we replaced him with the next most popular (Suljovic).
These eight players are what we will refer to from here on in as our Focus Group, and most of the analysis will be centred on them, although we will reference the wider sample as a whole, the patterns it has shown and other players within it.
Ask any dart player and they will probably tell you that throwing on stage in front of a crowd is nervier than doing it behind closed doors at a Players Championship event. However, over five and a half years roughly two thirds of our whole sample averaged higher on TV compared to their overall average for that period. In many cases, the increase on TV is not what we would consider to be statistically significant – in other words not big enough for us to believe there is potentially any reason for it other than pure chance. Without getting too mathematical, we calculate this with a technique using the standard deviation of the sample to help give us a cut-off point for what is “abnormal.” The cut-off varies depending on the category that we are measuring.
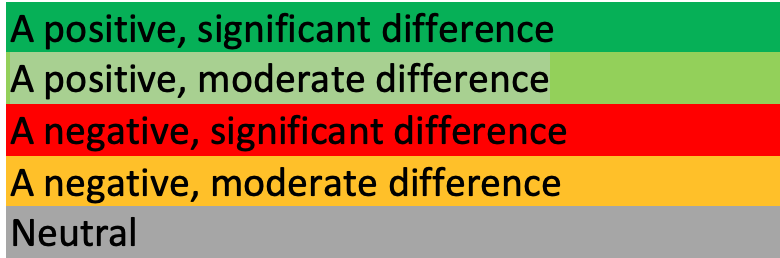
We have used the key below to show how we have labelled the results based on this calculation – you will see these colours against each stat that we present:
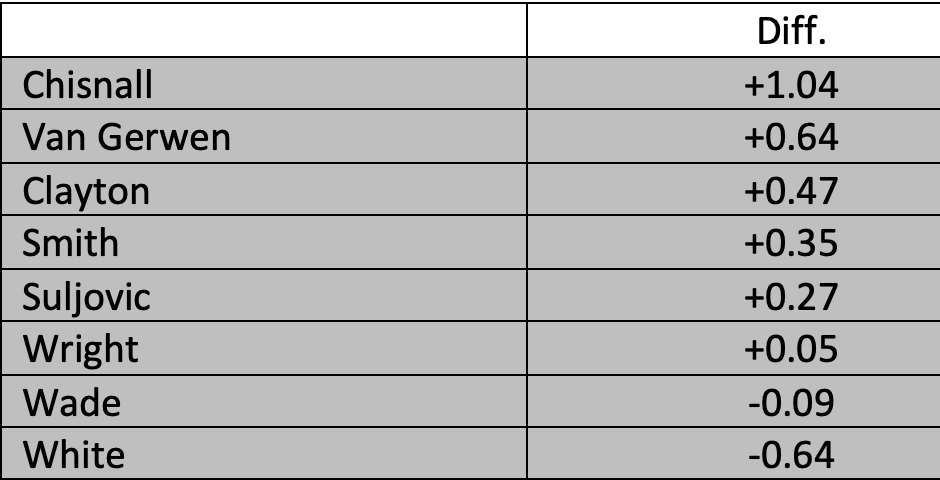
Within our Focus Group, five players were higher when performing on TV. Dave Chisnall came out best with a positive variance of +1.04.
Difference in Averages on TV vs. Normal
The player with the biggest difference in favour of performing better on TV, of those outside the Focus Group but in the wider sample, is Dimitri Van den Bergh who is +2.5 points. Luke Humphries is next (+1.7). These examples fall within the ‘significant’ and ‘moderate’ ranges.
Continuing in the TV environment, we looked at darts at double only. Just 19% of the sample are more precise on doubles when playing on TV, than on the floor. The sample ranges from a 10% drop (Danny Noppert) to a 3% improvement (Mensur Suljovic), with the average accuracy difference being -1.7%. Noppert is an interesting case because he attracted 6% of survey respondents calling him out as one of the best. On the other hand, Suljovic was one of the four rated as the worst. Over nearly 3,000 darts thrown at double, The Gentle is in fact more reliable in front of the cameras than he is on the floor. More expectantly, Jonny Clayton also demonstrates better accuracy in these circumstances whilst all others in the Focus Group are less accurate, ranging from -1.5% to -5.4%.
Difference in Double Accuracy on TV vs. Normal
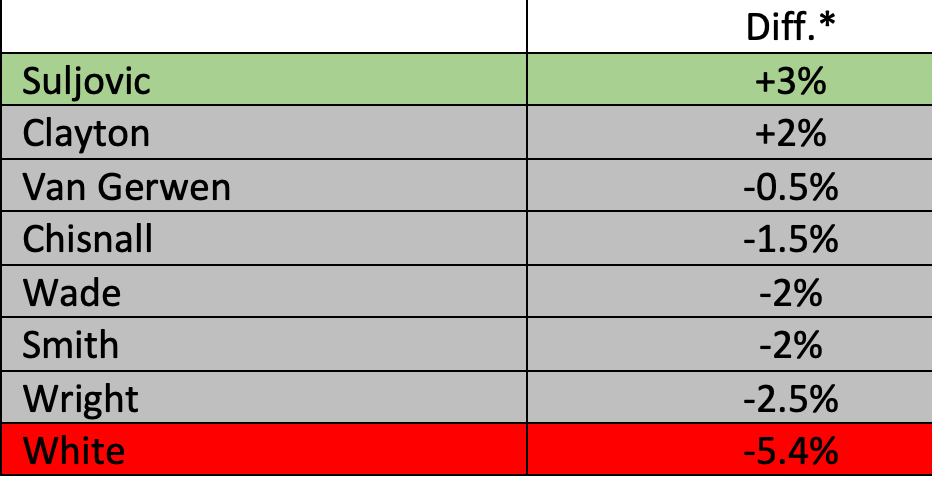
*NB: this difference is a percentage and not percentage points. Taking Ian White as an example, he is 38.59% overall and 36.53% on TV. This is a difference of 2.03 percentage points but a difference of 5.4% in accuracy.
Various studies into the effects of pressure on performance suggest that heightened nerves can work in someone’s favour, up to a point, before they become destructive. To align with this, we would expect to see a trend of declining accuracy as we add additional layers of pressure. We started with floor to TV, then added shots at doubles, and we can add another layer by looking at double attempts when a player’s opponent is also on a double (‘pressure doubles’).
The average change in accuracy across the sample when going from darts at double on TV to pressure doubles, is -1.9%. Less than half of the sample (42%) hit more darts at double in these situations.
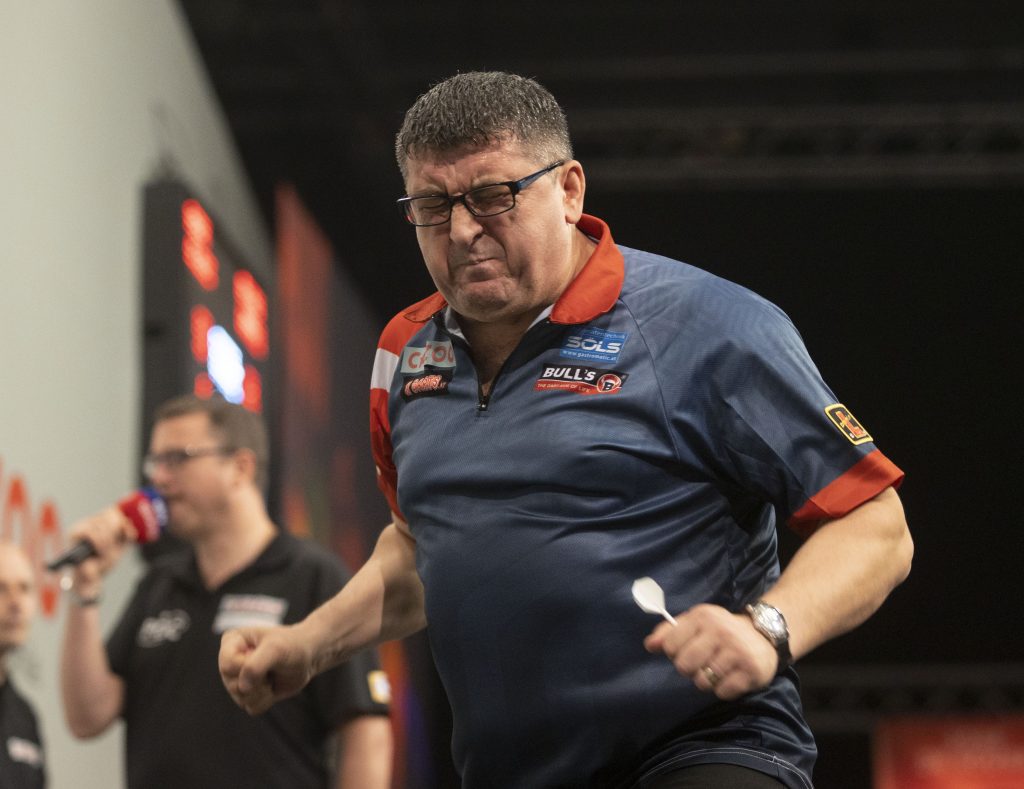
From what we have seen so far, we can therefore indicate that on average players are 1.7% less accurate when going for doubles on TV, and a further 1.9% less accurate when those attempts come with the added tension of knowing they are likely to lose the leg if they miss. Despite this trend, there are plenty of players who defy it. One of these is Noppert, who is 10% less accurate than his regular double standard when going from floor to TV, and yet he is 5% more accurate than his regular double standard when you add the additional pressure (in theory) of an opponent waiting on a double. Strange. Seemingly random patterns like this exist for Ryan Searle, Nathan Aspinall and Jermaine Wattimena to name a few – all of these (plus others but to lesser degrees) do not follow the general trend. Within the Focus Group, Suljovic’s numbers answer his critics once again although Chisnall, White, Wade, Wright and van Gerwen show a noticeable change in the opposite direction.
Accuracy Difference when Going for Pressure Doubles
Cranking up the pressure another notch would be the instance of throwing a dart to clinch a match (although it will depend a lot on how close the match and leg are, and this study doesn’t go to that level). The sample size is much smaller here but still sticks to our minimum of 200 darts thrown for inclusion.
On TV James Wade has hit 42.41% of his match darts at double since the start of 2017, which is the second highest on the tour in absolute terms (Nathan Aspinall is the highest) and yet it is still 0.5% lower than his regular TV accuracy.
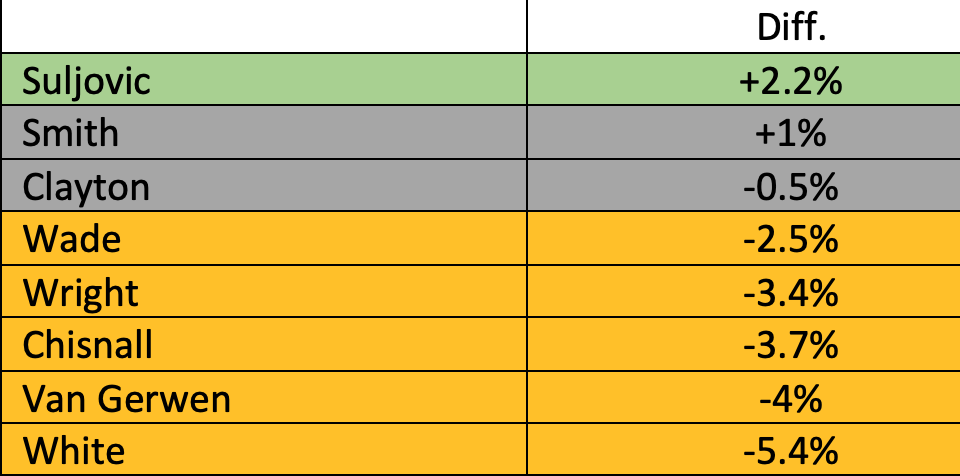
About 20% of the sample were better on match darts than their regular double performance on TV. Notably, two of these were Chisnall and White (going against the grain of popular opinion), albeit the differences are tiny (less than 0.5%) so they fall into our statistically neutral category. No other players in the Focus Group had a positive difference when going for match darts. The player with the biggest positive difference within the overall sample is Nathan Aspinall (+6%), and the player with the biggest negative difference is Gabriel Clemens (-15%). The average difference is -3%.
Differences in TV Match Dart Accuracy vs Normal TV Double Accuracy
Peter Wright is an eye catching 11% less accurate when going for doubles to clinch a match.
That’s four measures so far, three of which display a lower level of performance, on average, in the more tense scenario.
Looking at deciding legs is another indicator and possibly a more stable one as it is less ambiguous – every deciding leg should carry some level of weight that makes it bigger than most other legs, from a player’s perspective.
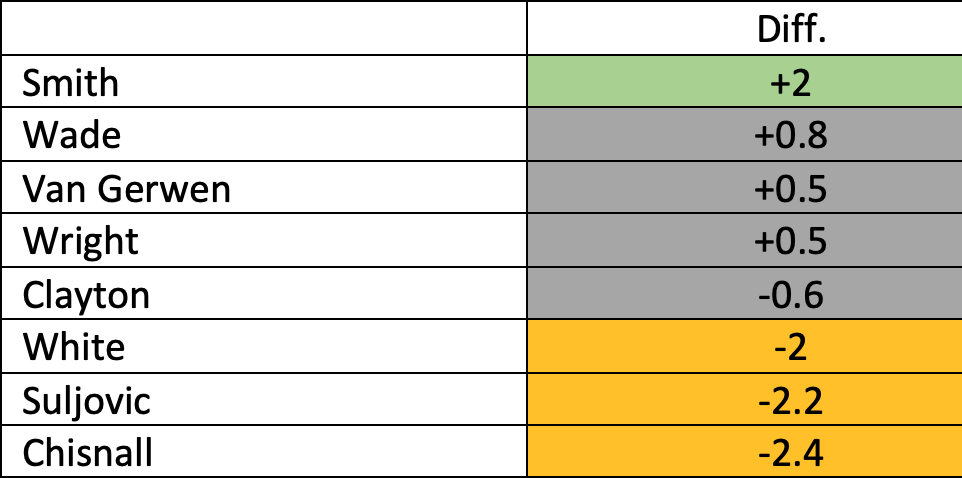
The average difference of players in the sample is -0.8 points when comparing their regular averages to their averages in deciding legs. The players showing a notable difference within the Focus Group are Smith (+2), Chisnall (-2.4), Suljovic (-2.2) and White (-2.4).
Differences in Deciding Leg Averages vs Normal Averages
Ultimately what matters is whether the player does more than his opponent in the leg, which is why we also reviewed leg win percentages in deciders compared to normal leg win percentages. Having the throw (or not) of course plays an enormous part in this, but over a long enough period one would expect the throw to be with the player about 50% of the time – increasing with the higher ranked players, and particularly players who are known to be better bullseye throwers. We record bullseye accuracy when going for finishes (on stage only) and this is the most reliable indicator we have of the likelihood of a player winning the bullseye (in the absence of us knowing who threw first in each historical leg – something we are working on getting). We also assume here, that the player opts to throw first when winning the bull-up. Within the Focus Group, the pecking order for bullseye accuracy since 2017 is as follows:
- James Wade
- Michael van Gerwen
- Mensur Suljovic
- Dave Chisnall
- Michael Smith
- Peter Wright
- Ian White
- Jonny Clayton
This order aligns quite closely with the difference of deciding legs won compared to normal legs won for each player:
% Deciding Legs Won vs. % Normal Legs Won
Wade is about 40% more accurate than the average on the Pro Tour when finishing on the bullseye, so it is not inconceivable that he might win the bull-up and therefore have the throw in a deciding leg, around 20% more than most. In that context, his variance in deciding legs won versus normal legs is maybe not as remarkable as it seems. The same goes for van Gerwen and Suljovic. The problem is we cannot be sure that their bullseye outcomes when finishing, mirror their outcomes when setting up at the start of a match, so it is hard to know how much this data really tells us. All we can do for now is take the data at face value.
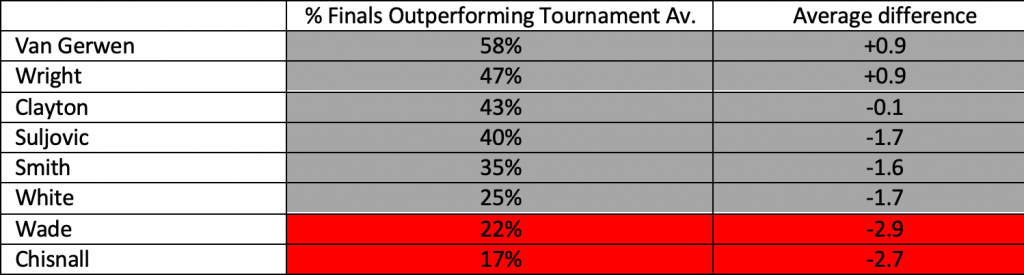
The last category we reviewed was performances in finals. Only Michael van Gerwen and Peter Wright from the Focus Group, produce higher averages in finals relative to their overall averages for the rest of each tournament in question. In 58% of the finals van Gerwen has contested since the start of 2017, he has outperformed his average for the tournament. Wright has done so in 47% of finals. These two are head and shoulders above the others. The average differences in finals can be seen below and once again, James Wade might surprise you. He has the biggest negative difference in averages when playing in finals, of all the Focus Group (-2.9%).
Averages in Finals
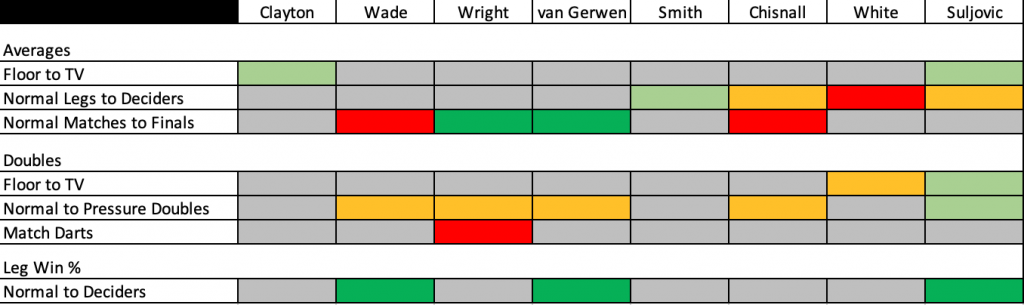
This category continues the pattern of the overall sample having, in the main, reduced performance when a layer of assumed pressure is added to the circumstances. That pattern is summarised in the below table.
Summary: Performance Measurement Categories
| Pressure Variable | Av. Difference Across Sample (when added) |
| Normal to TV | +0.34 |
| Normal Doubles to TV Doubles | -1.7 |
| Normal TV Doubles to Pressure Doubles | -1.9 |
| Normal Averages to Deciding Leg Averages | 0 |
| Tournament Averages to Final Averages (Same Tournament) | -1.2 |
Taking our eight players, we can provide an overall pressure performance summary for each, based on their variation from the norm (up or down) in each category that we tested. This is by no means a fully accurate picture given the restrictions of this research already highlighted, but it does raise some question marks over some very popular opinions.
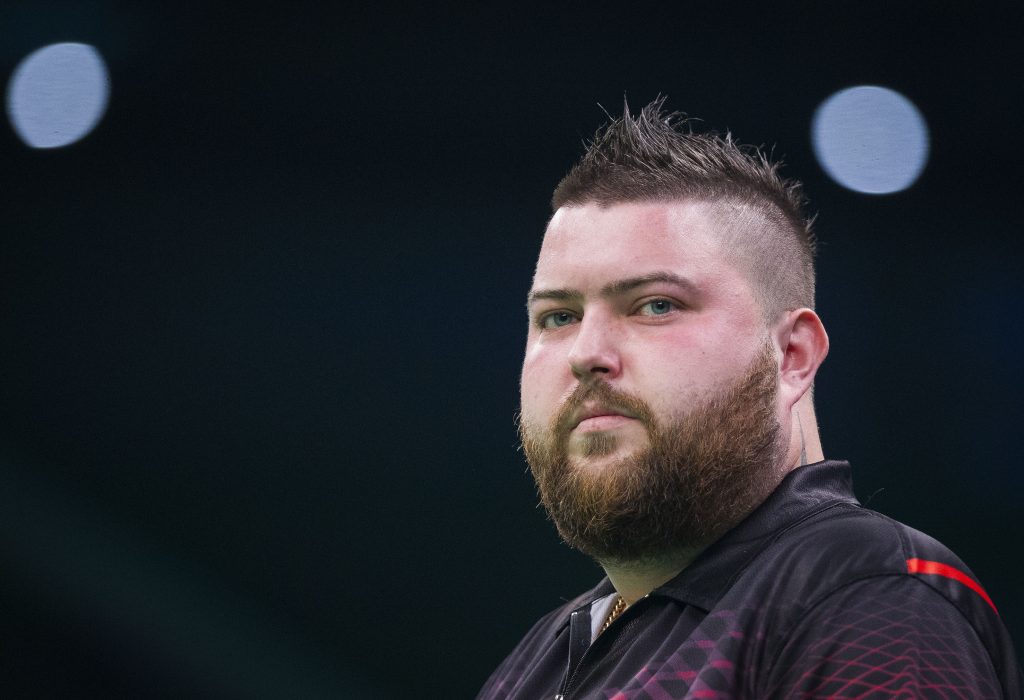
Smith is more neutral than many would guess, when you look at all of the data points over the last five years plus. Suljovic can feel even harder done-by to be labelled as one of the worst players under pressure, and of course both have been on the wrong end of some iconic moments. Smith most recently lost the UK Open final which he was expected to win and has lost two World Championship finals – the biggest stage of all – to a World No. 1 and a player who became World No. 1 three months later. Suljovic will be remembered for two capitulations against Fallon Sherrock which undoubtedly have cast a shadow over the Austrian’s mettle, despite him looking as solid as any of the players in this group when assessed across all of the measures at our disposal. Every player is going to have bad matches irrespective of how good they are – the more people those matches occur in front of, the longer they live in the memory. The reverse is true too – some may be surprised that the data on James Wade doesn’t paint a picture of the robotic assassin that many of us view him as, particularly the statistic on finals.
In our last article about going for the bullseye or laying up, we talked about how we are more likely to remember incidents that have greater emotional attachment to them. A missed double that cost us a bet, a 180 in a deciding leg of big match, a dramatic checkout to save a match of high importance. We also have a tendency to seek out information which supports a belief we already hold rather than information which challenges that belief – something known as Confirmation Bias. We unconsciously place more weight on evidence that reinforces what we already think and are more dismissive of evidence that appears to contradict it.
Thanks to everybody who sent their views in and congratulations again to the winner of our prize. This is an area for more research, and it will be fascinating to see how young guns like Luke Humphries and Dimitri Van den Bergh fair as their data samples enlarge.
One final note. In the time this research has been conducted, Michael Smith has won another two titles, both of which have escaped our data sample due to the timing of them. One was hosted in Madison Square Garden of all places, as well as being on TV and against the legend that is Michael van Gerwen. Perhaps this is the start of the Bully Boy narrative in the minds of some sections of the darting community, beginning to shift.
Editorial Staff